Graph work
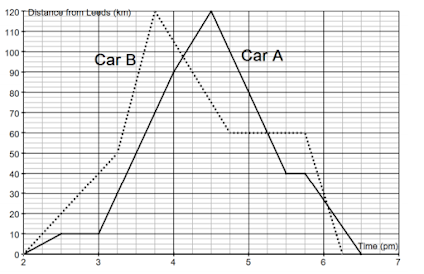
The graph below shows the progress of two cars in a race from Leeds to Blackpool and back again. Car A is the bold line. Car B is the dotted line. Answer the 4 questions below the diagram.
1) How far is it from Leeds to Blackpool?
2) Which car was winning at 3.30pm?
3) Which car was winning at 4.15pm?
4) What was the distance between the cars at 4.45pm?

1) Well, of you look at the point they started going back it is at 120km meaning from Leeds to Blackpool, it is 120km long.
ReplyDelete2) At, 3:30 you can see that the dotted line (Car B) is higher in the graph meaning it has travelled farther. It only means it has travelled farther because the distance line is the y-axis. This gives us an answer, Car B.
3) We can do the same thing as we did for problem 2 but check for 4:15. This will give you Car A.
4) On the graph, Car A had travelled 100 miles and Car B had 60 miles. 100 - 60 = 40. This gives you 40 miles